Health Care sample data
Our sample PatientData database has a few tables, and the sample reports are being created during first connection:
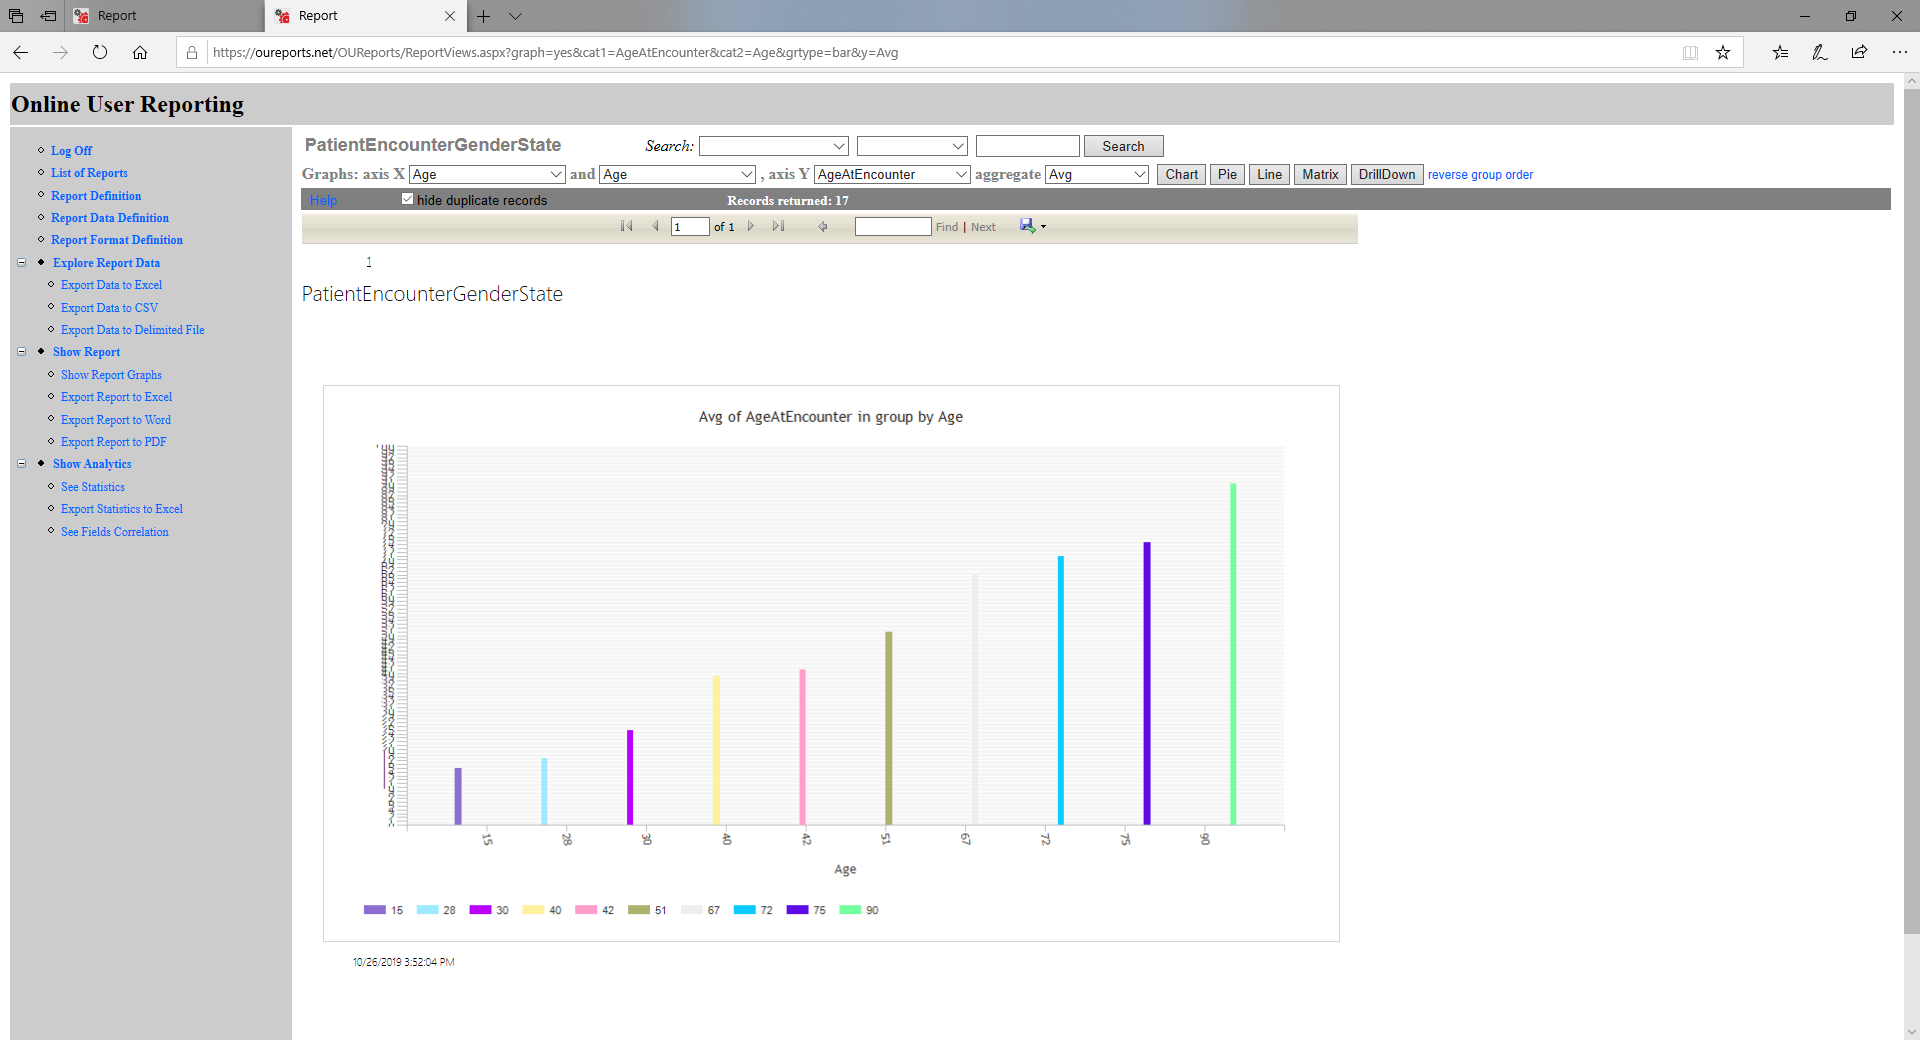
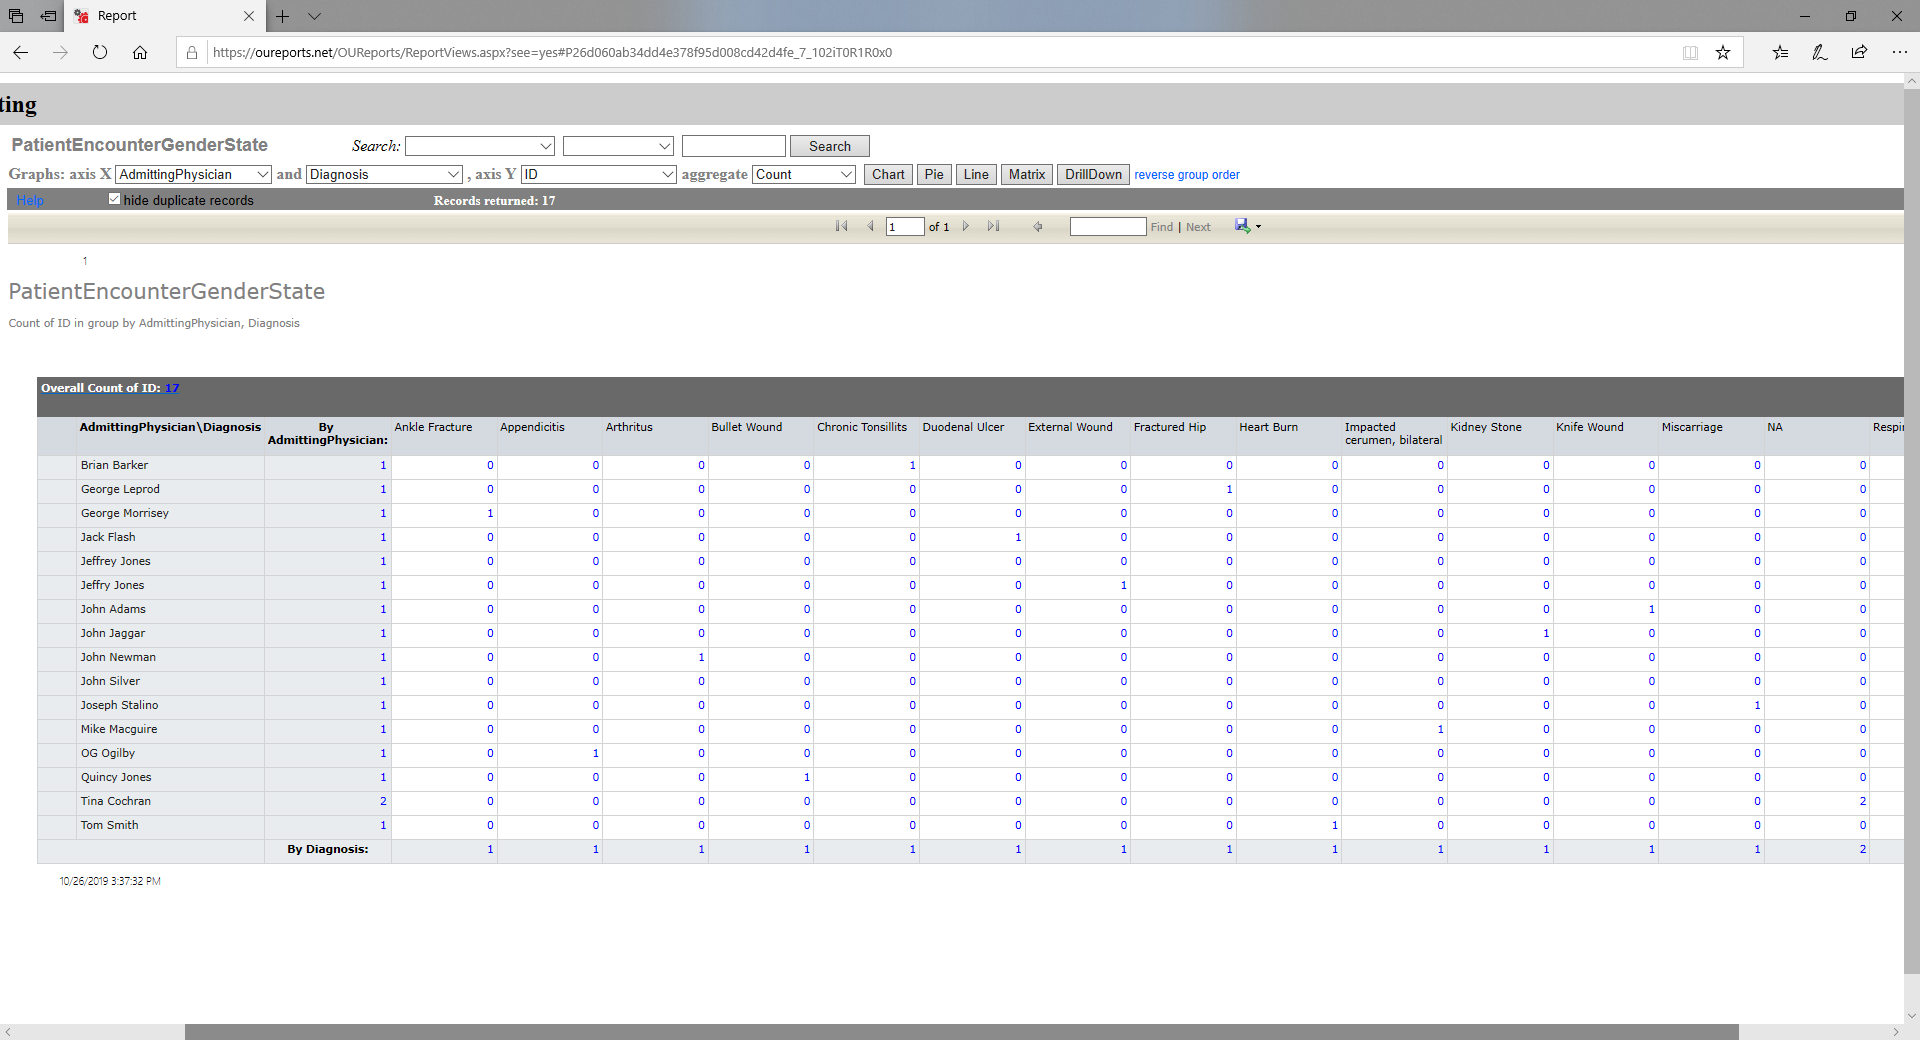
Click on PatientEncounterGenderState link. It will open the report:
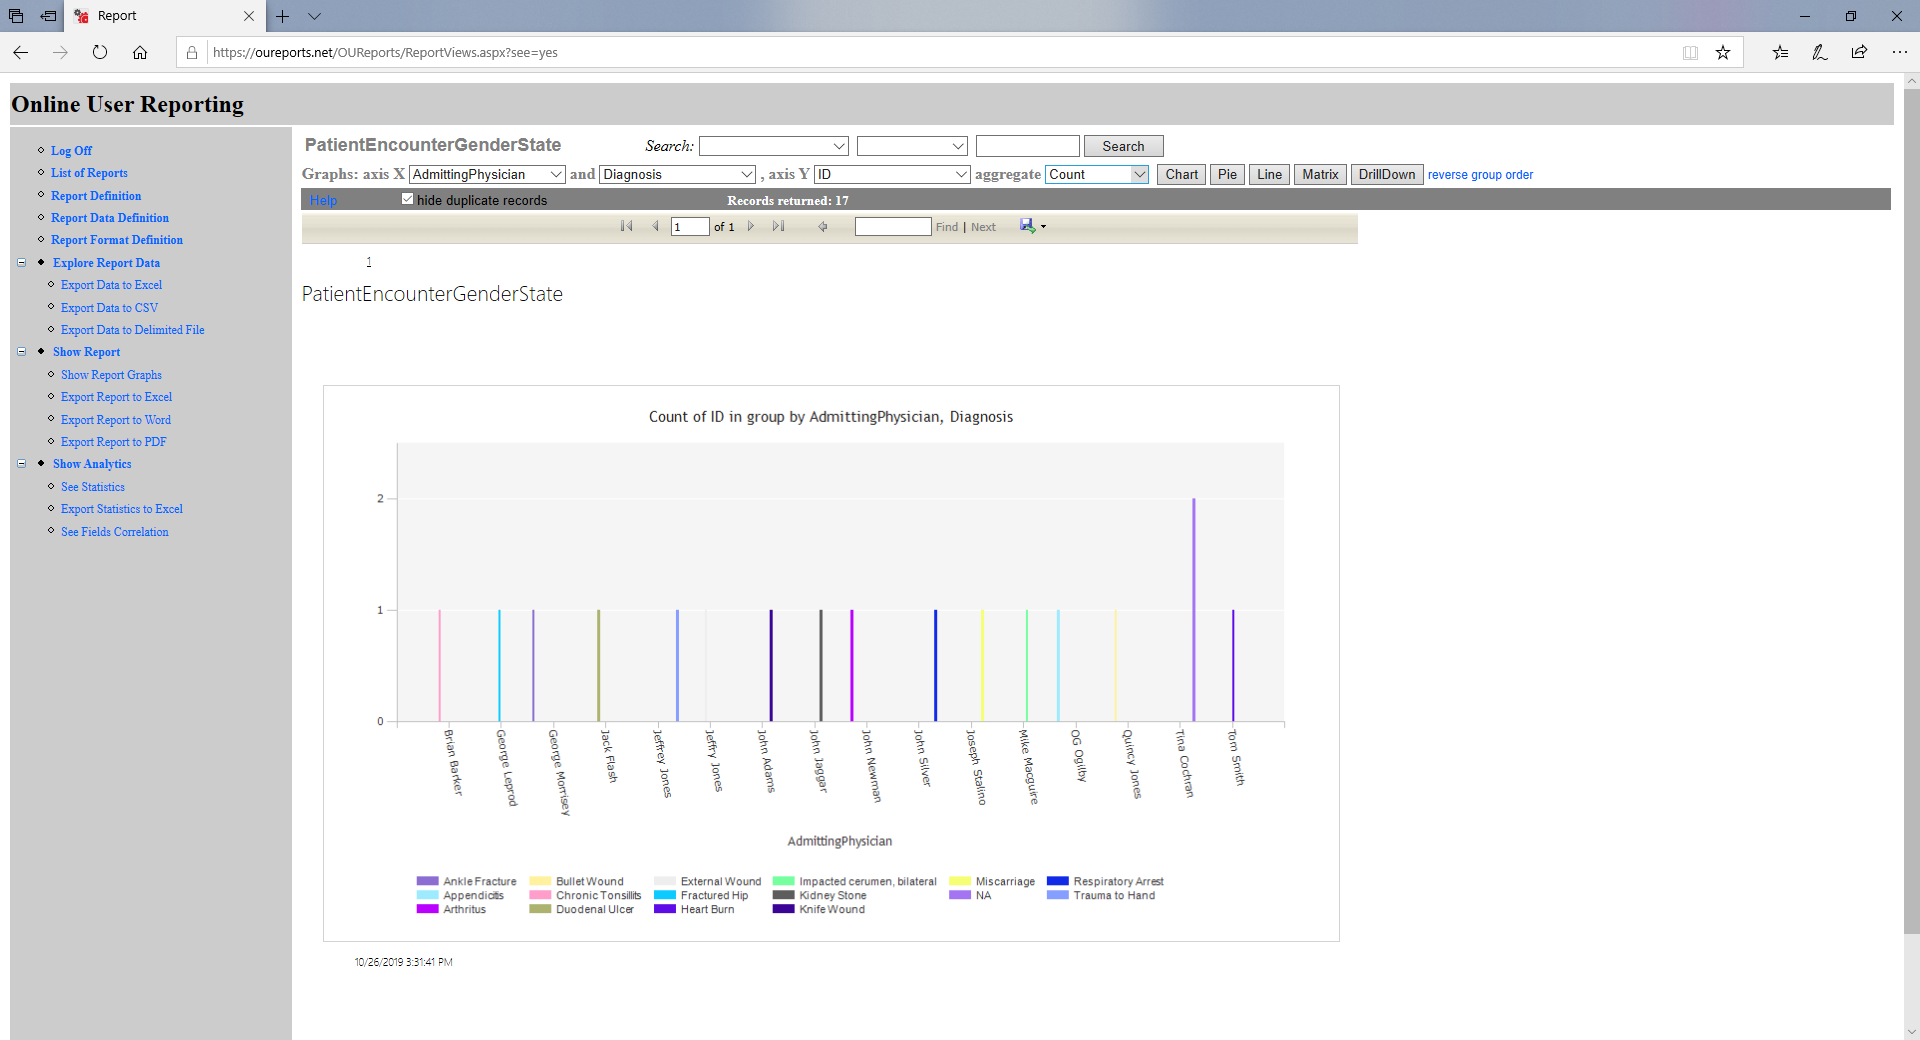
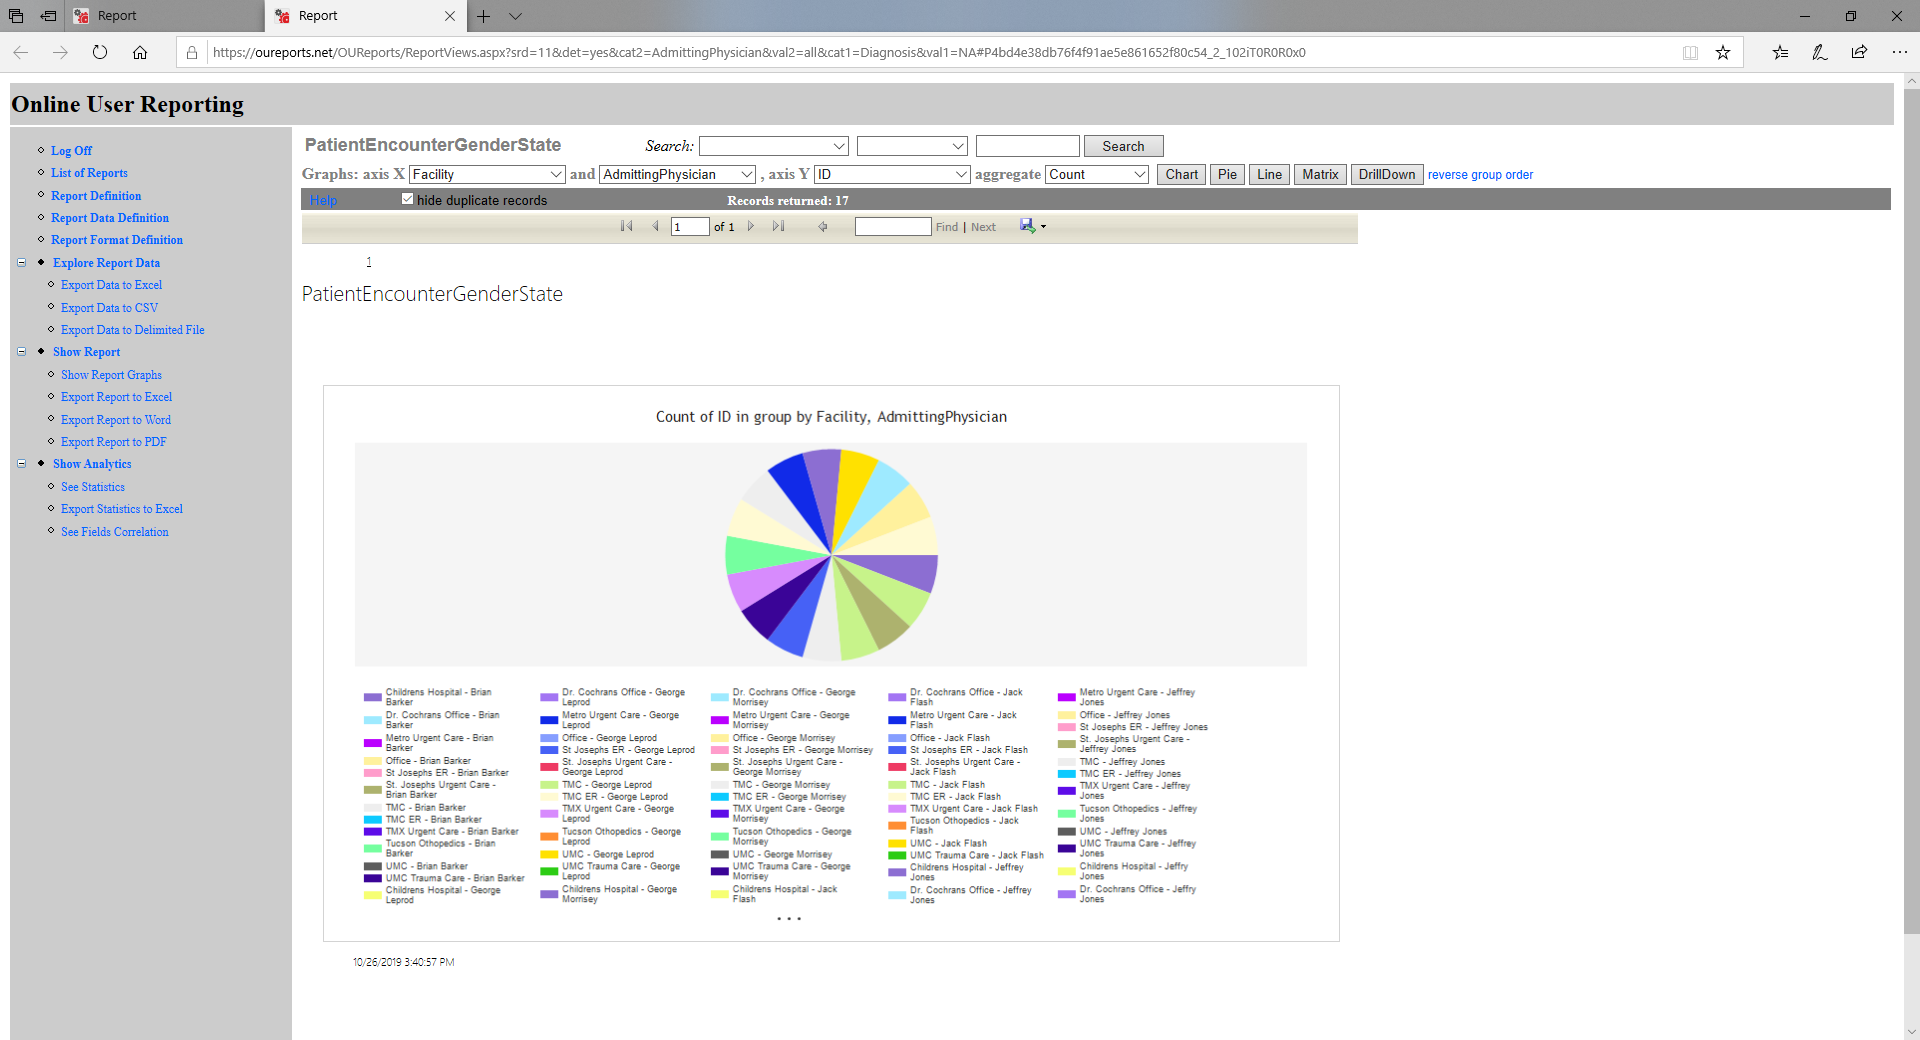
Select group categories for graphic reports, Axis X, Axis Y, and aggregate function and click on Chart button:
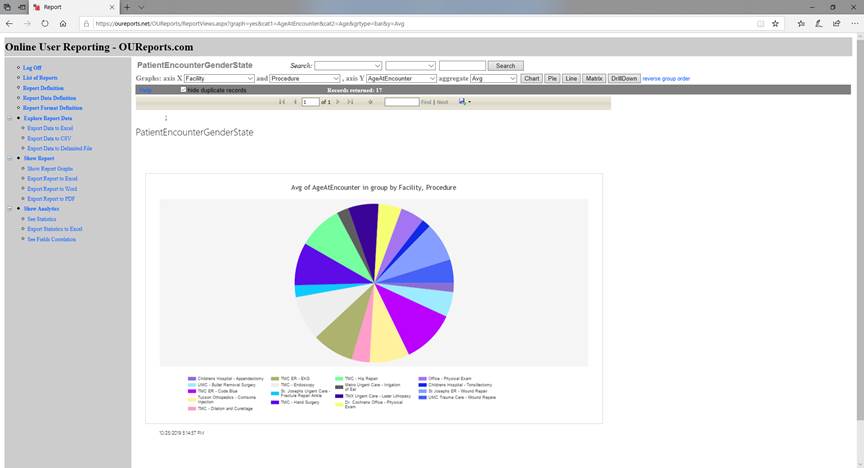
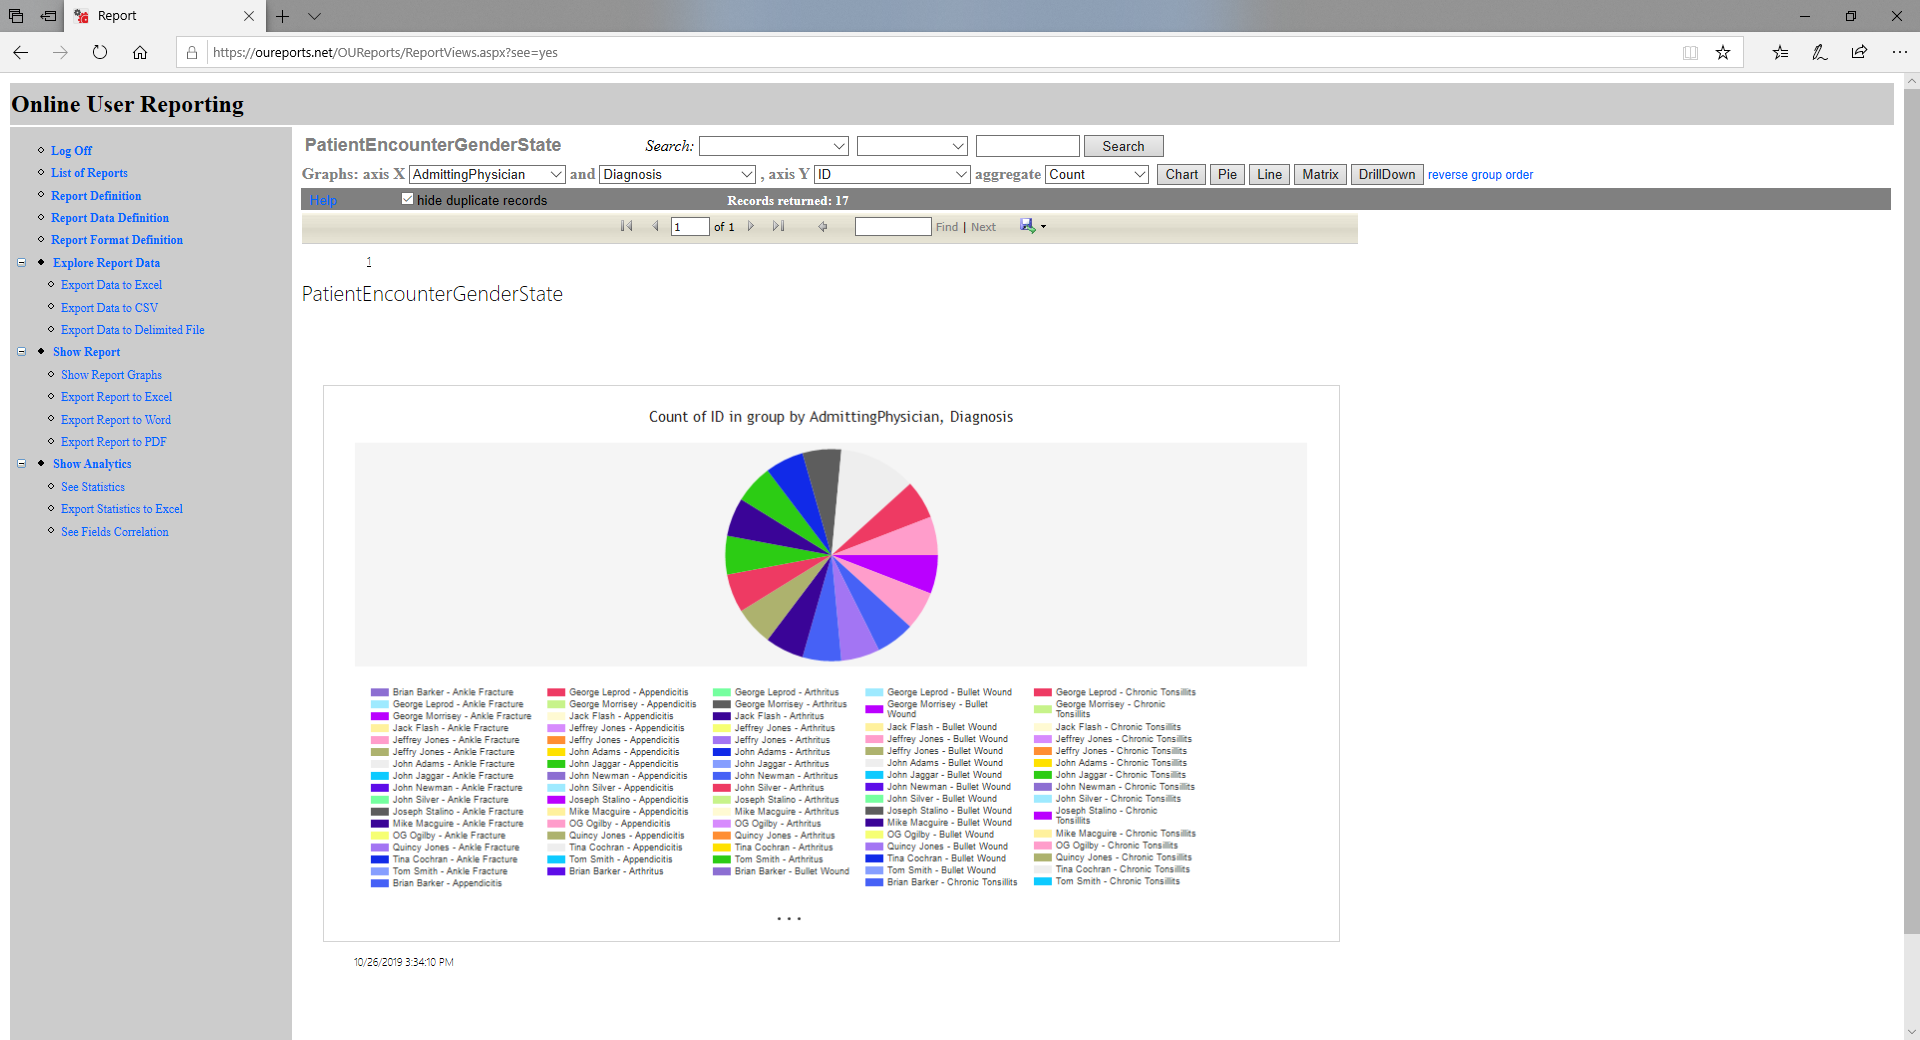
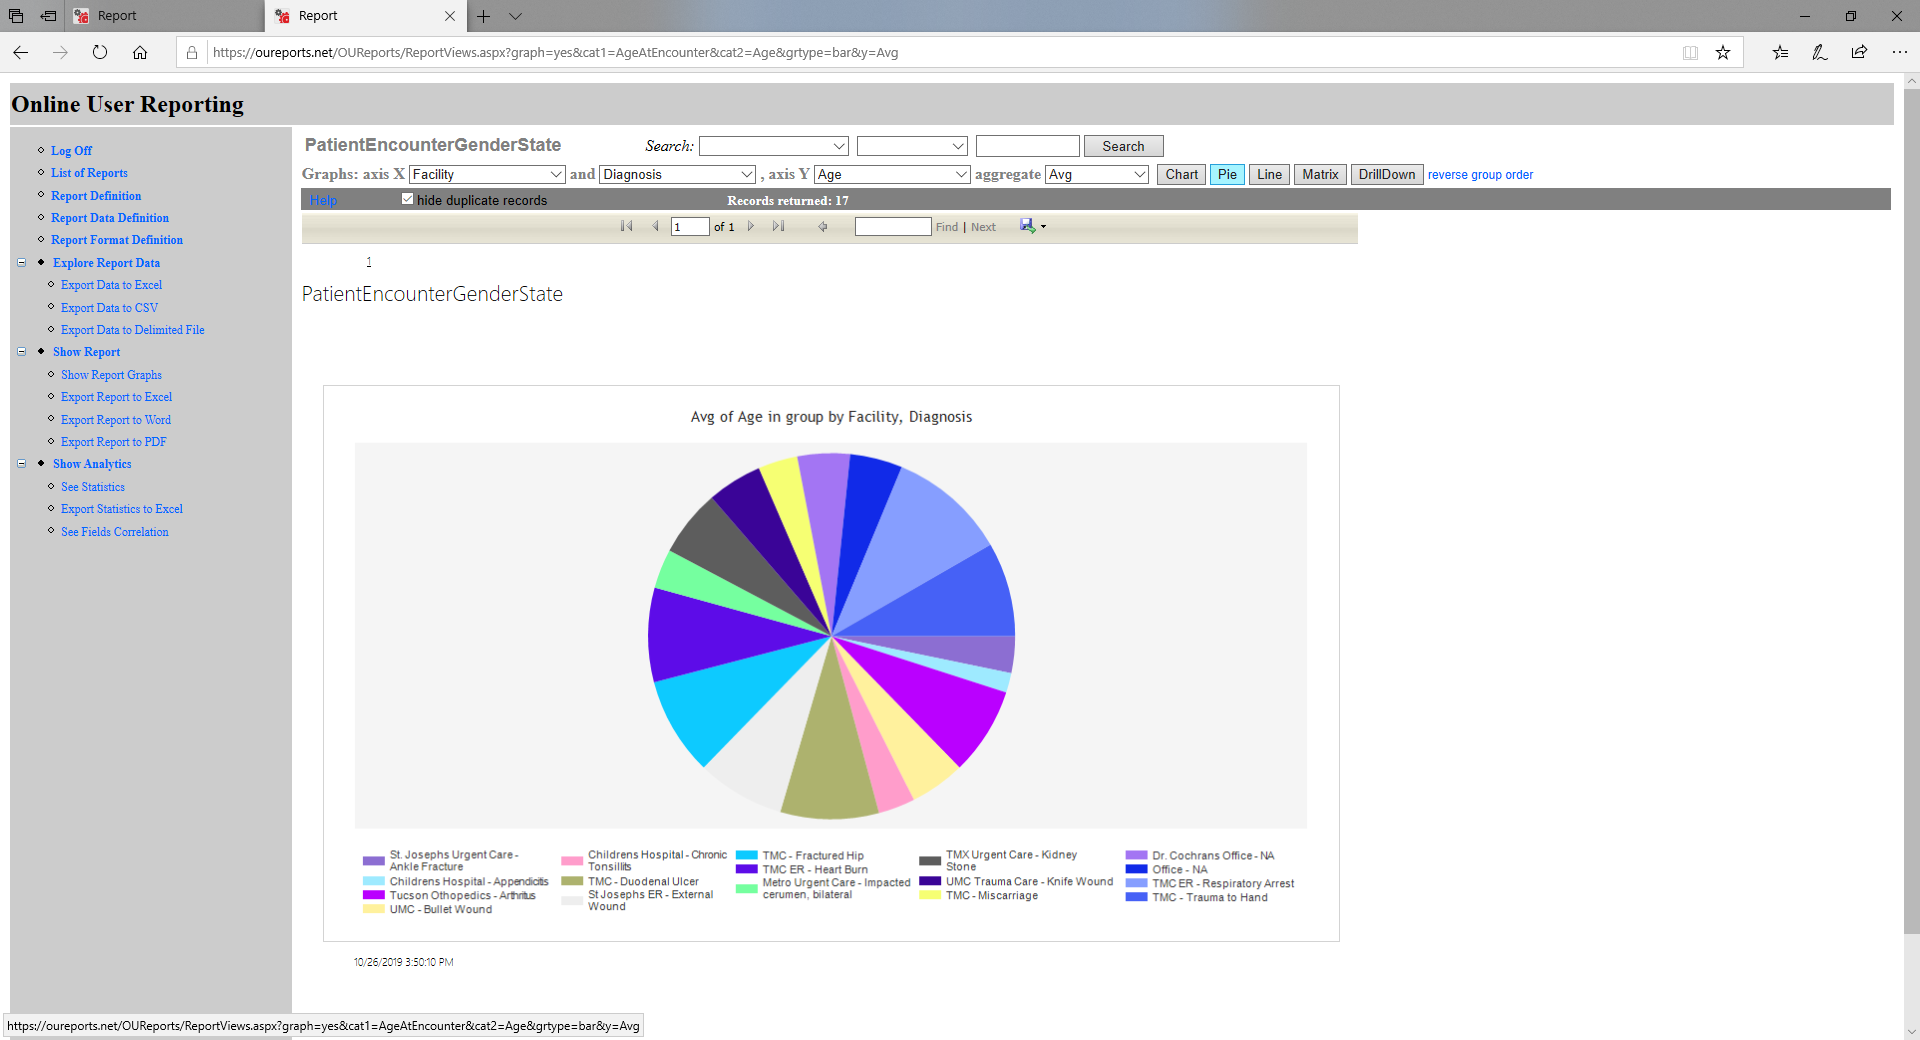
Pie:
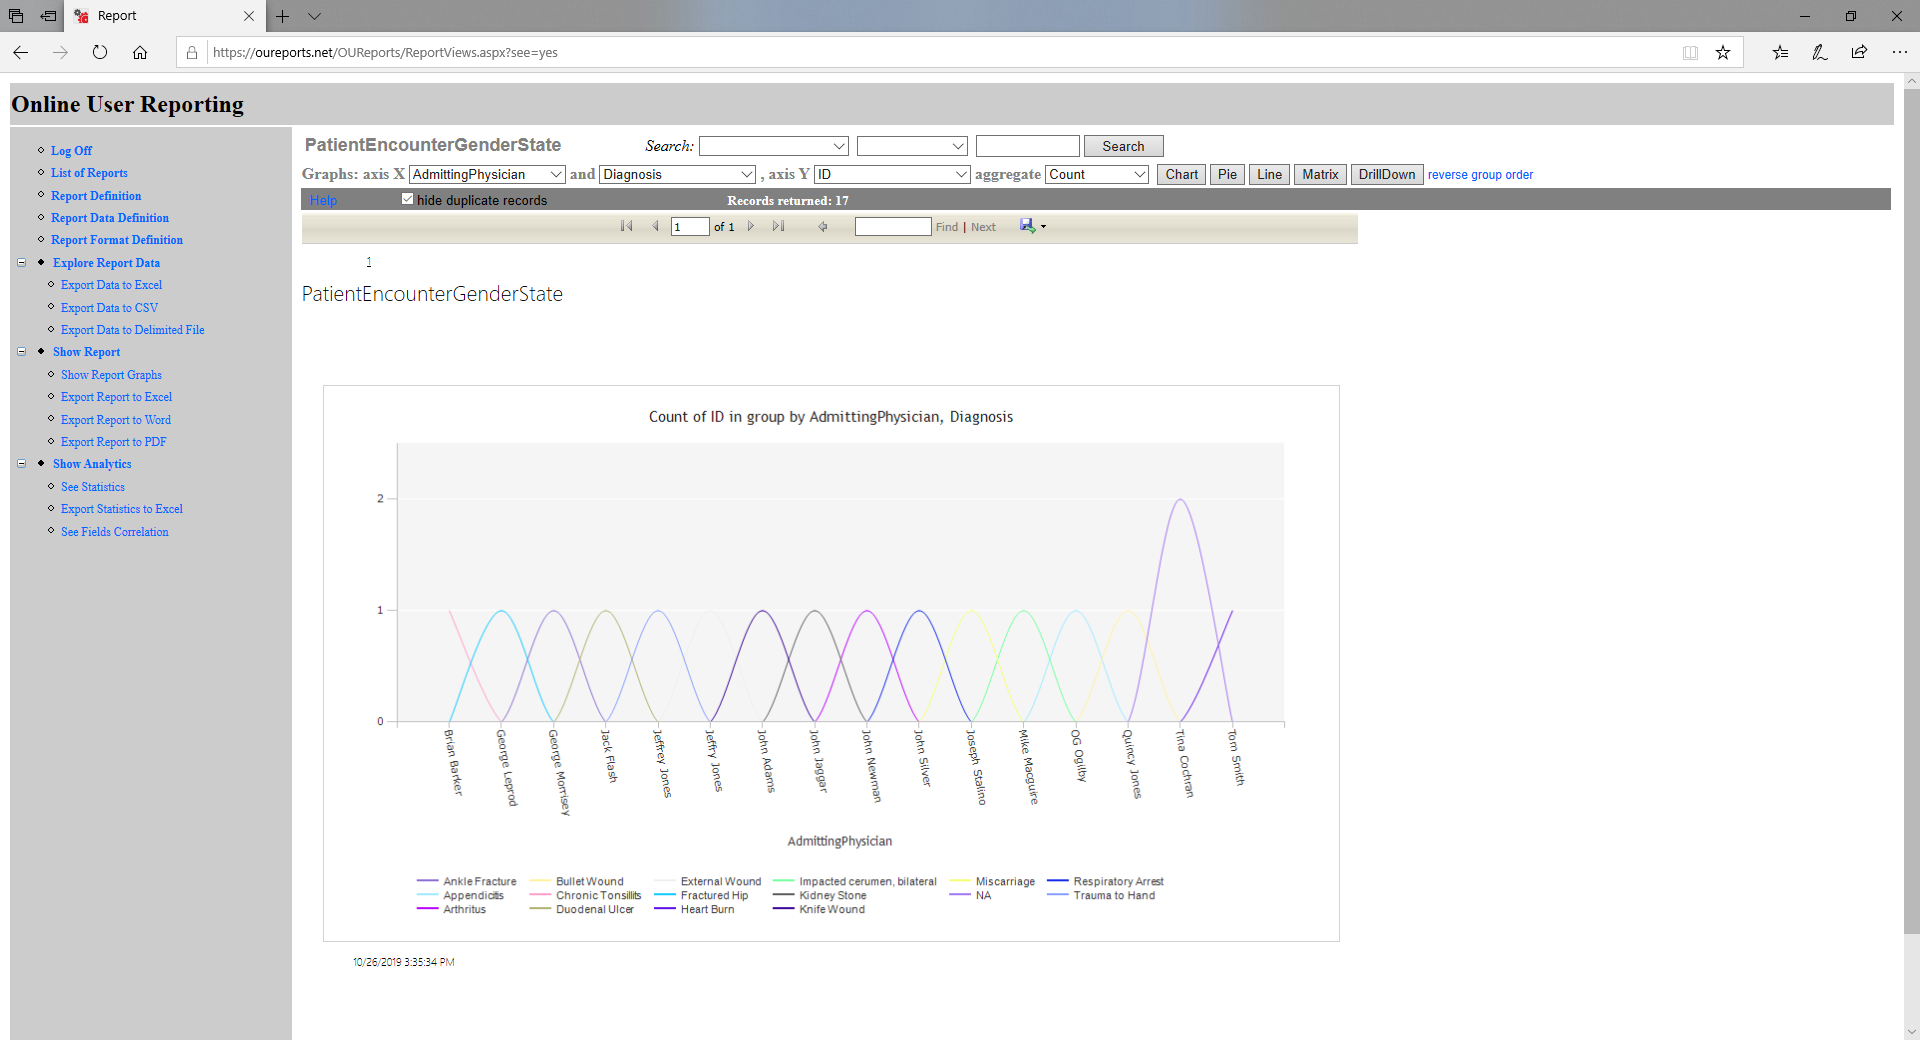
Line:
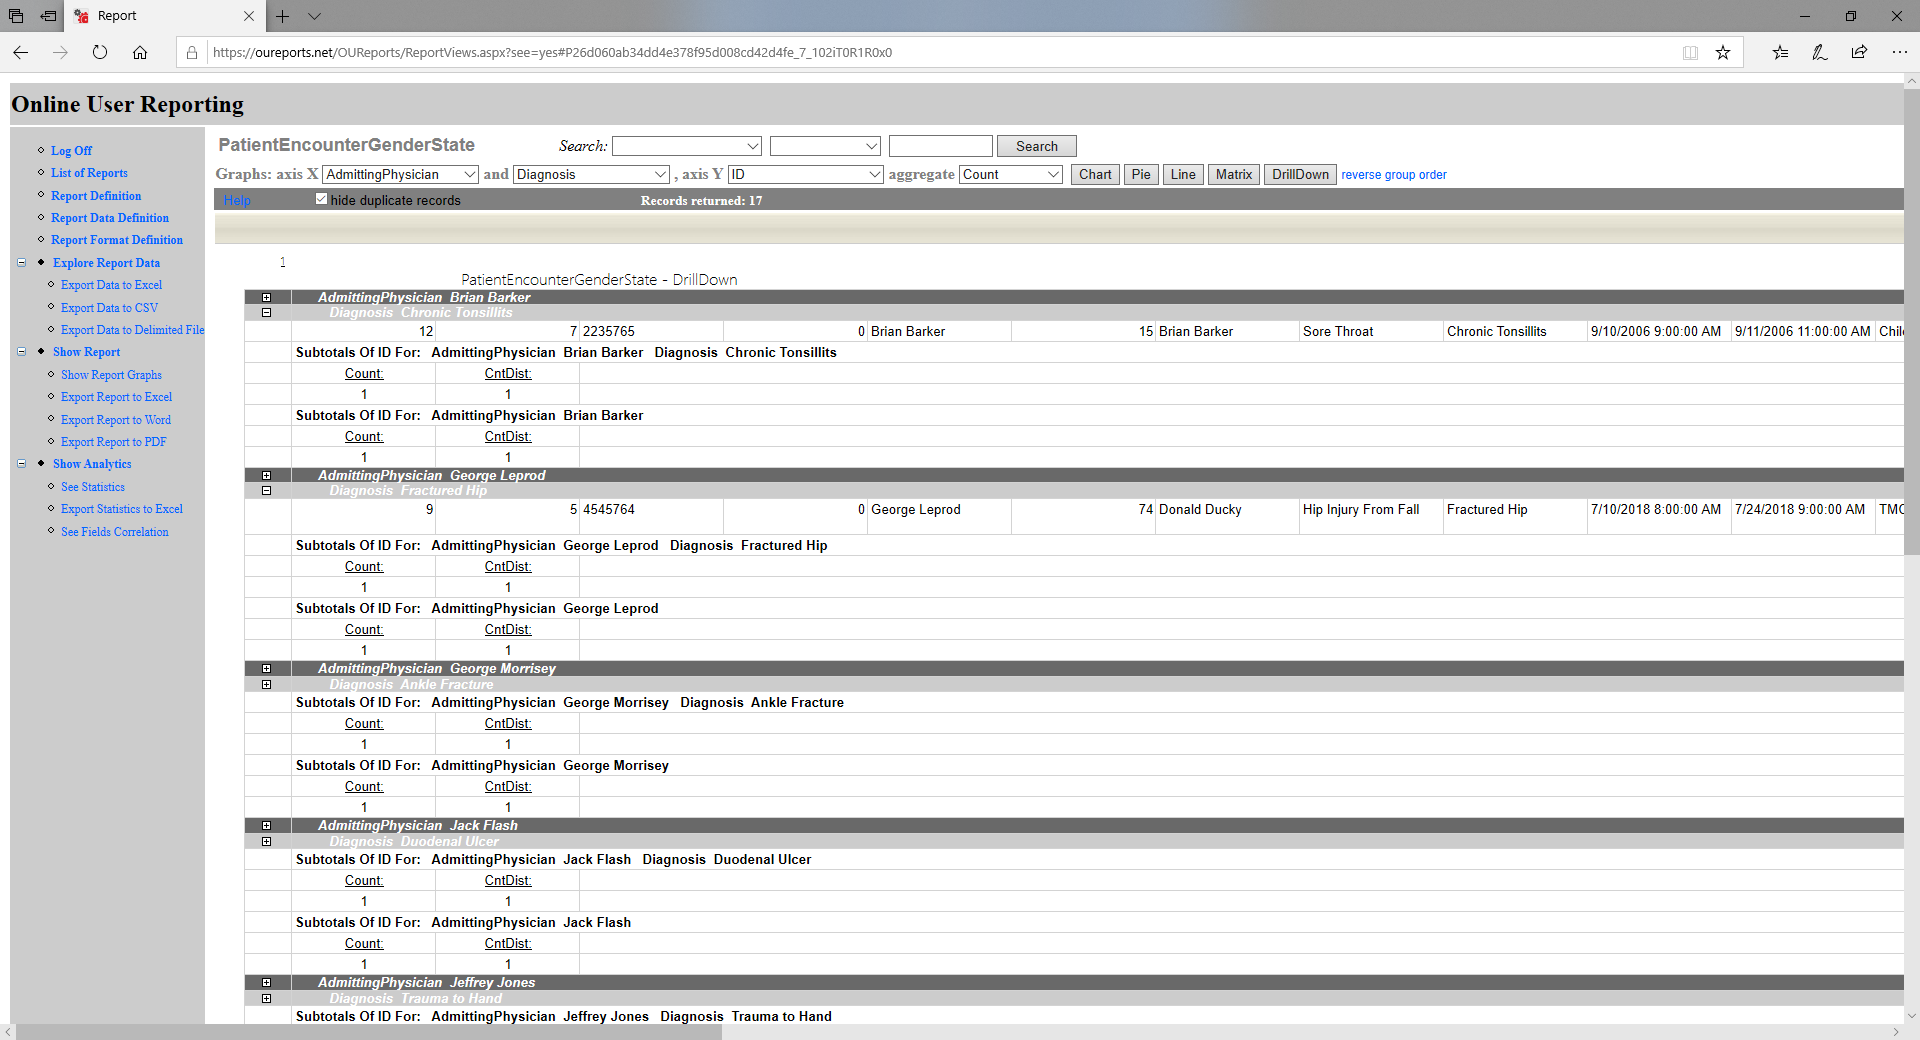
Drill Down button:
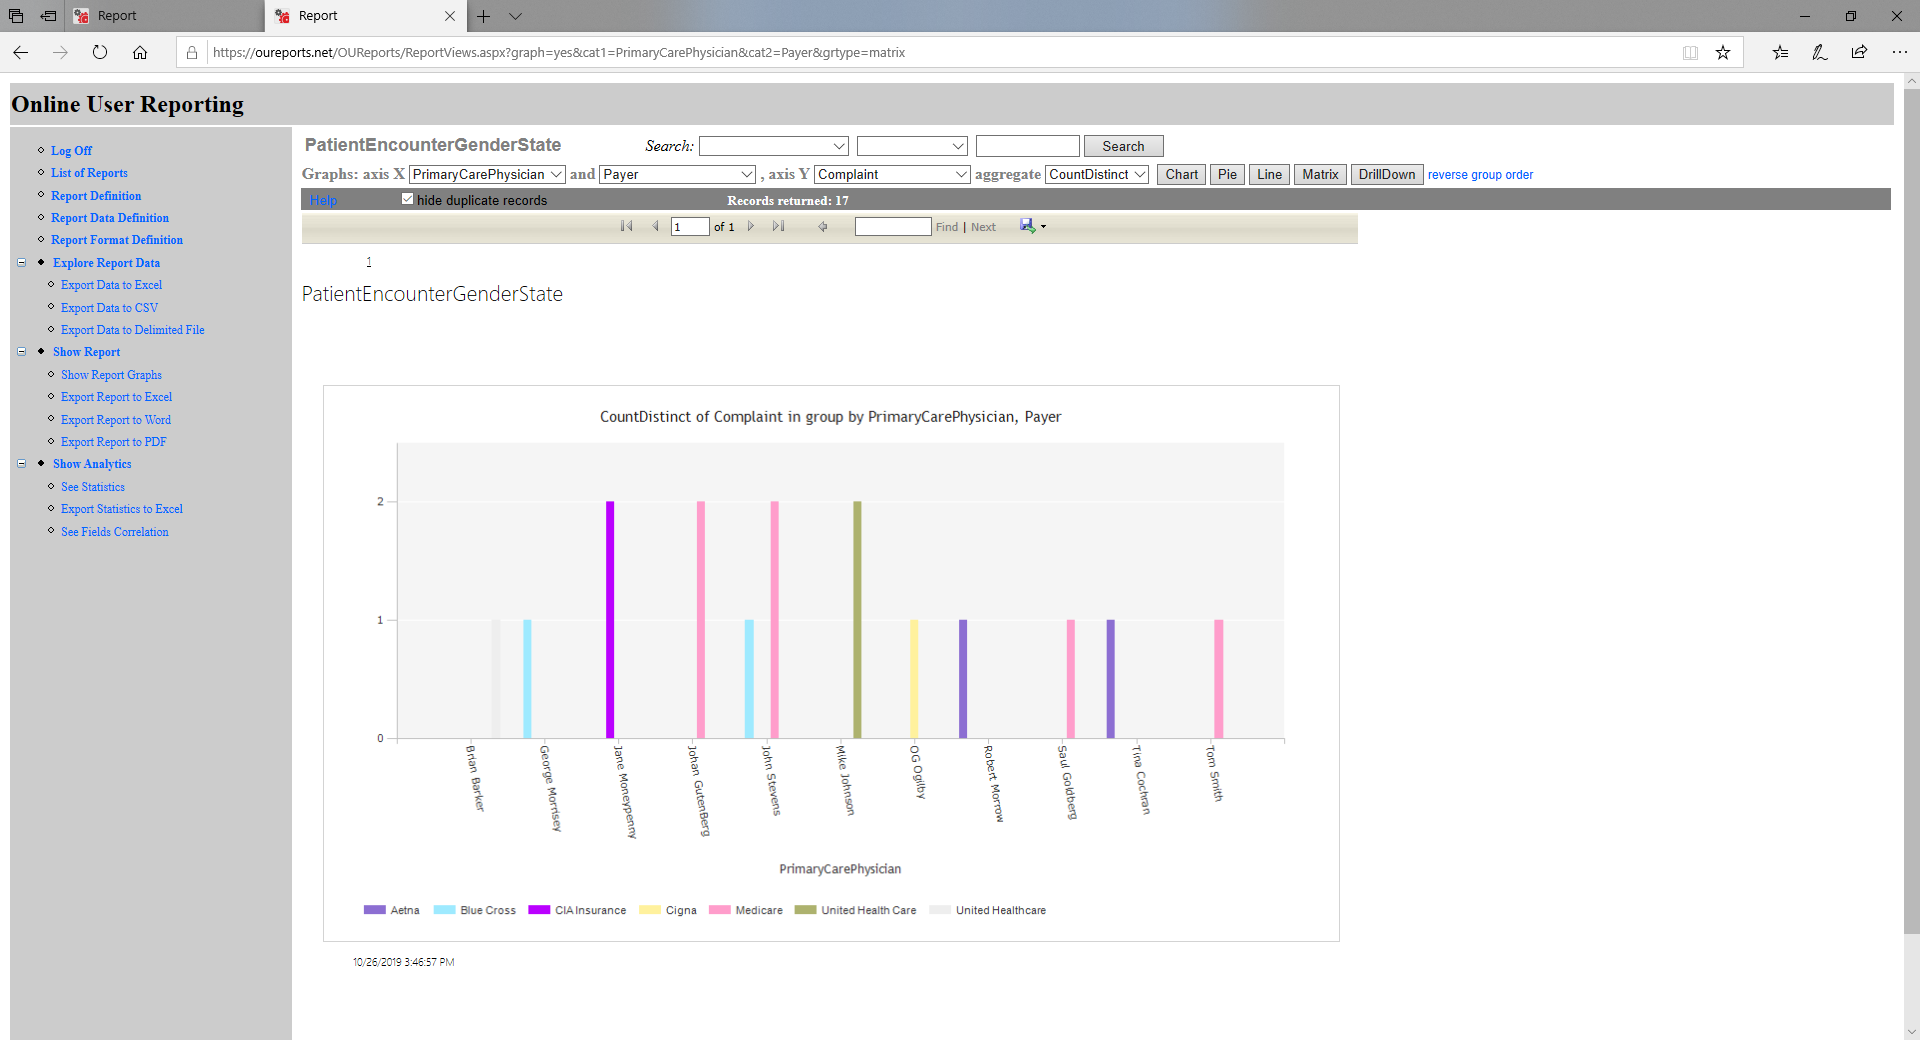
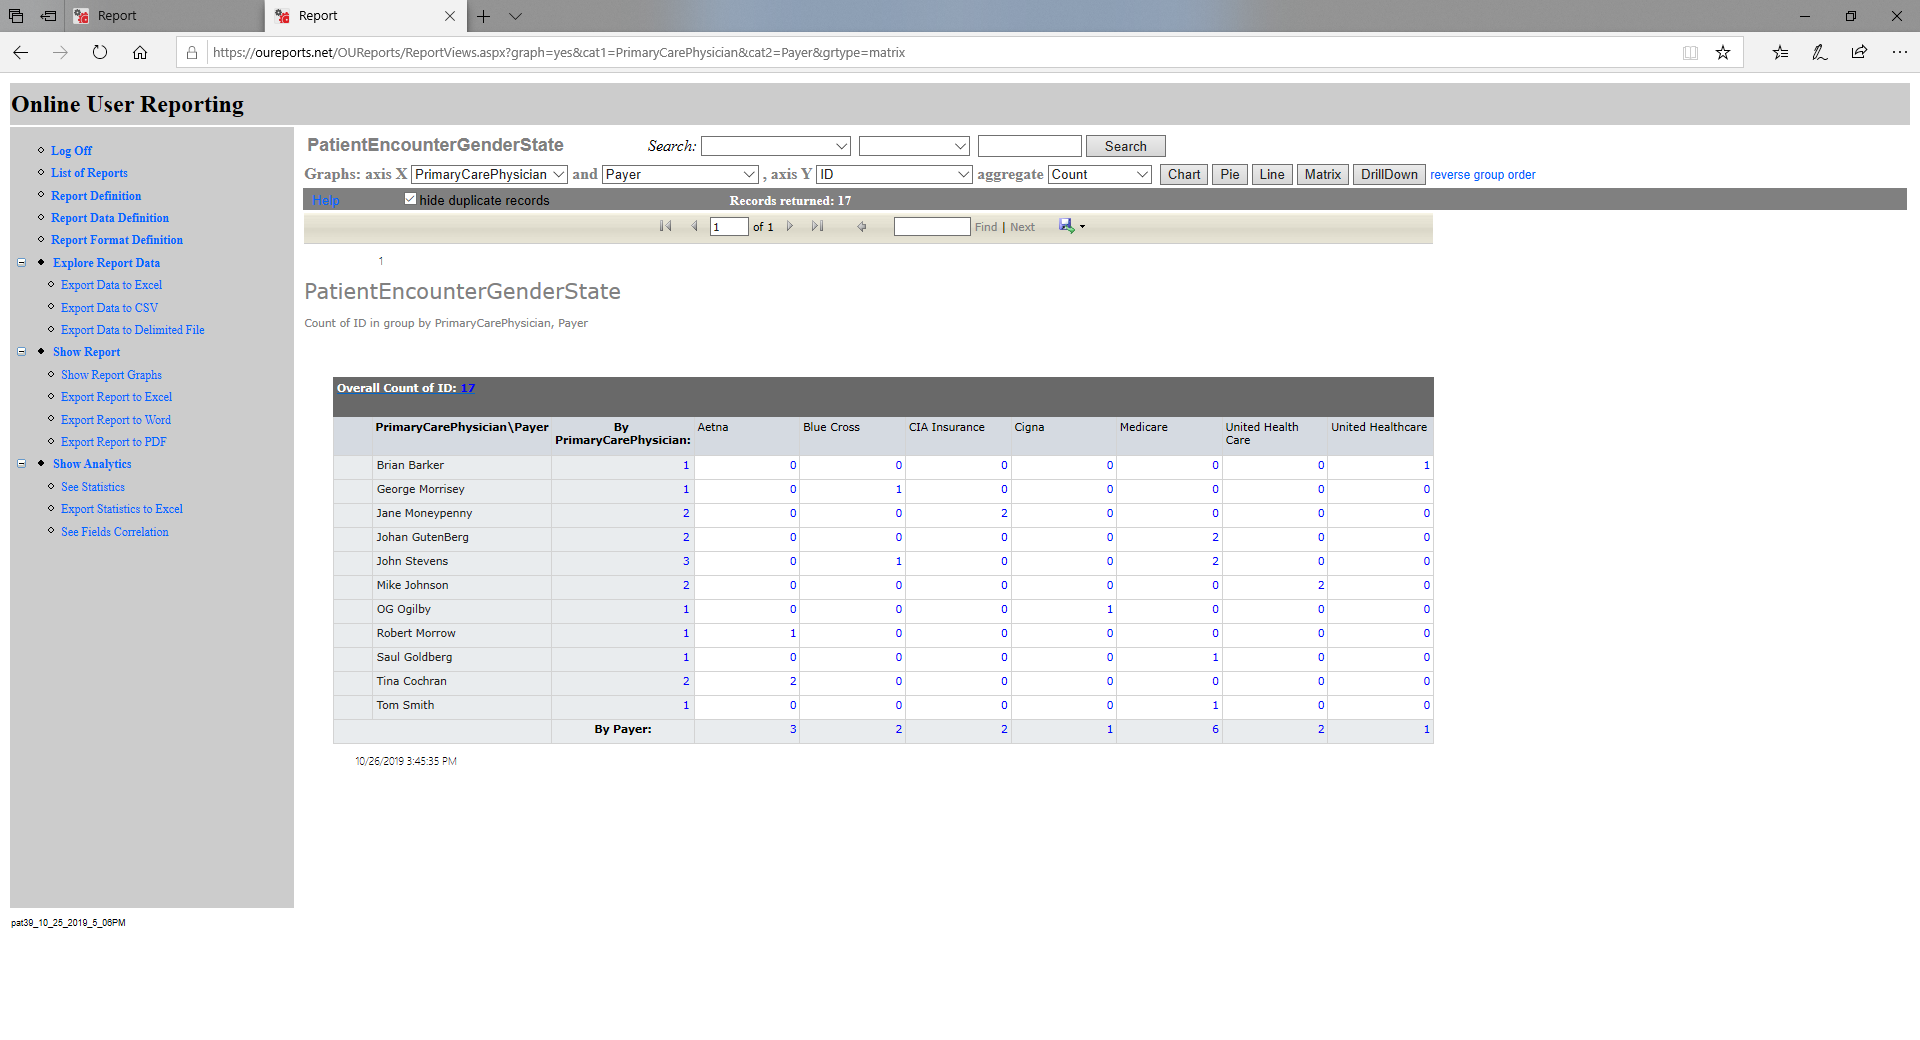
Matrix:
Reverse group order:
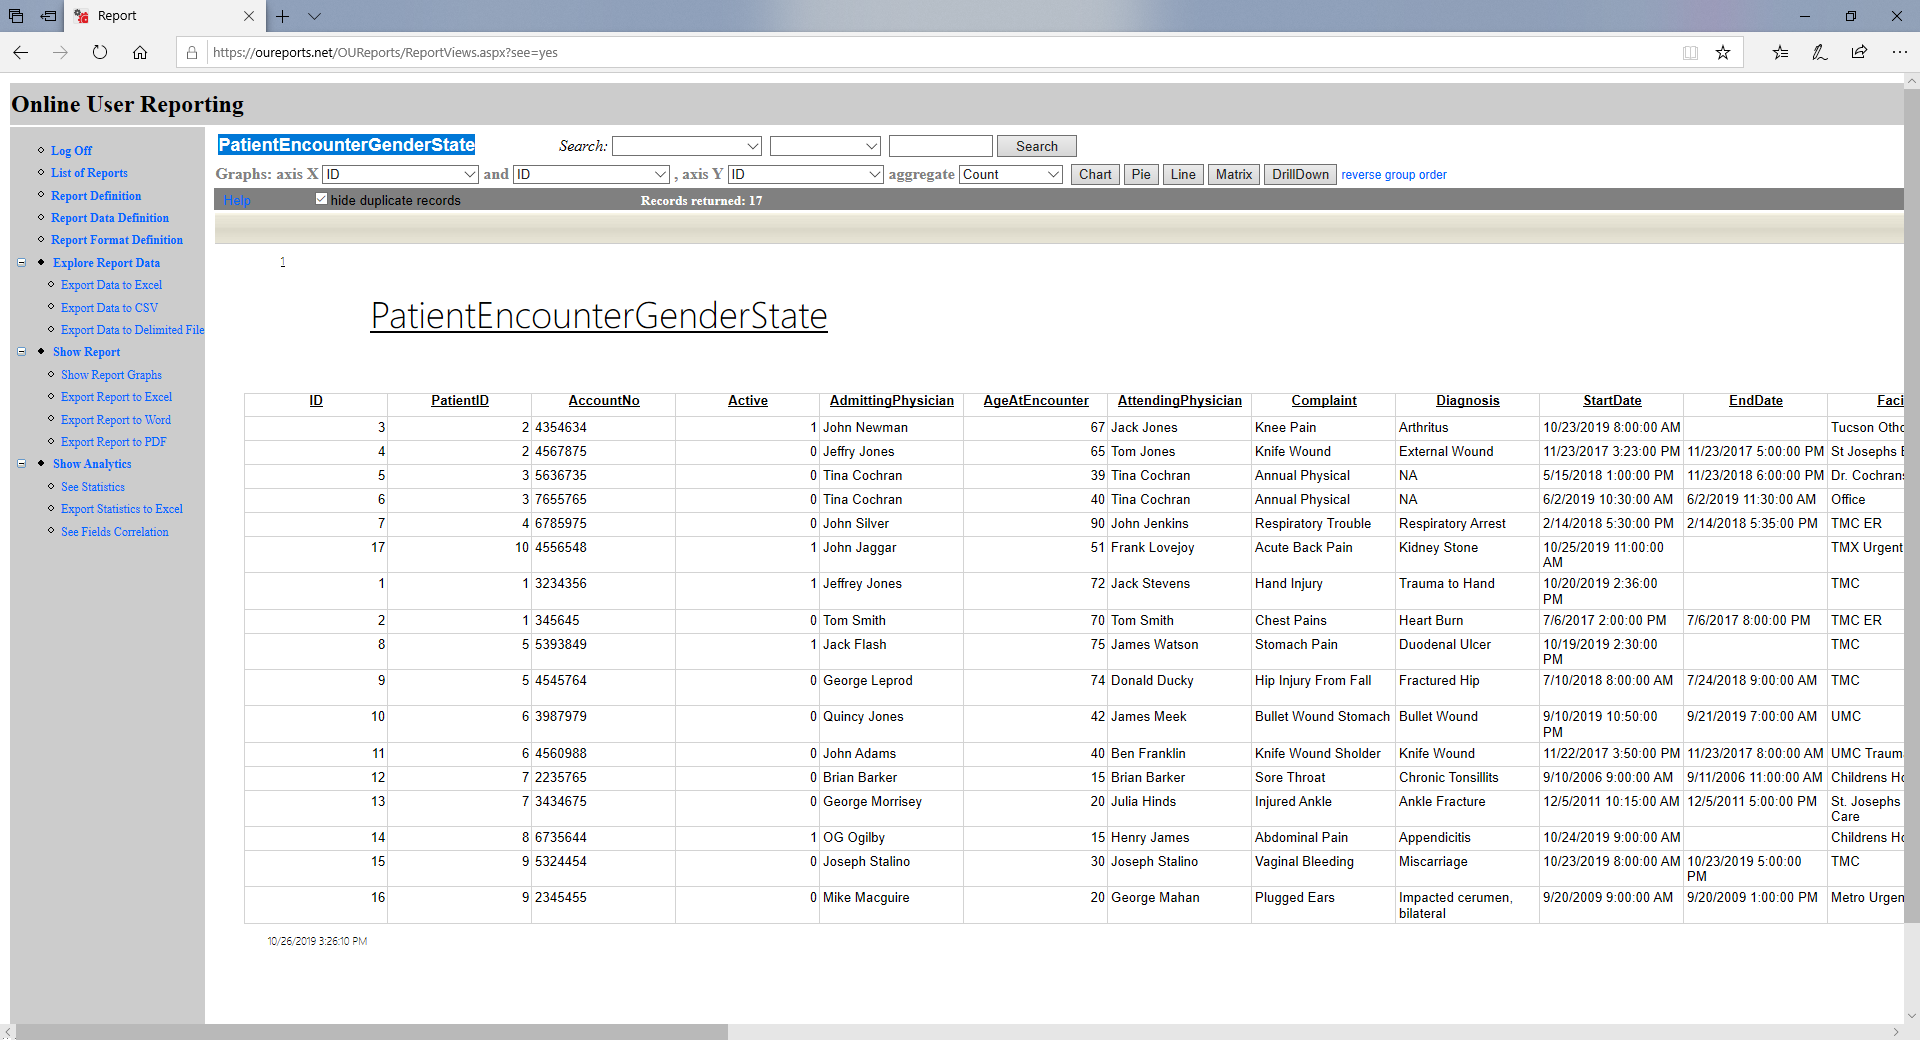
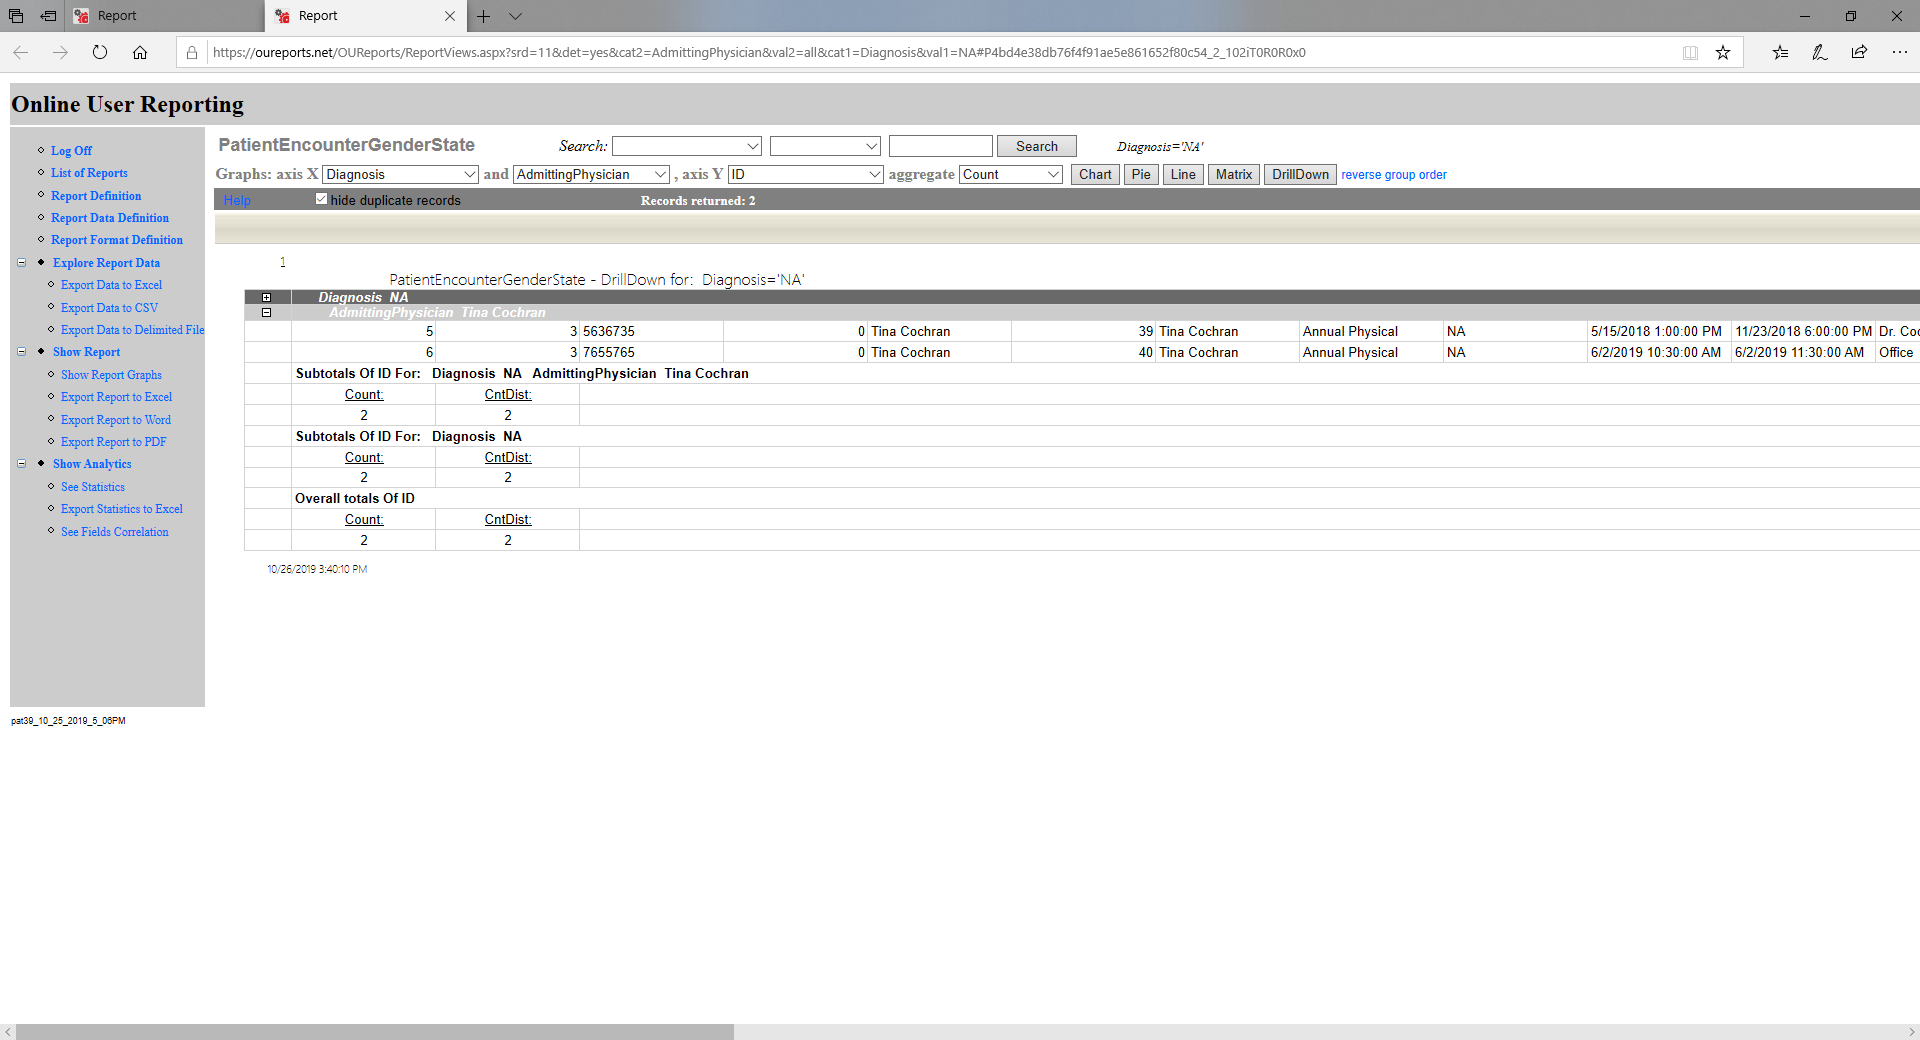
Each link in table will open drilldown report for corresponding records:
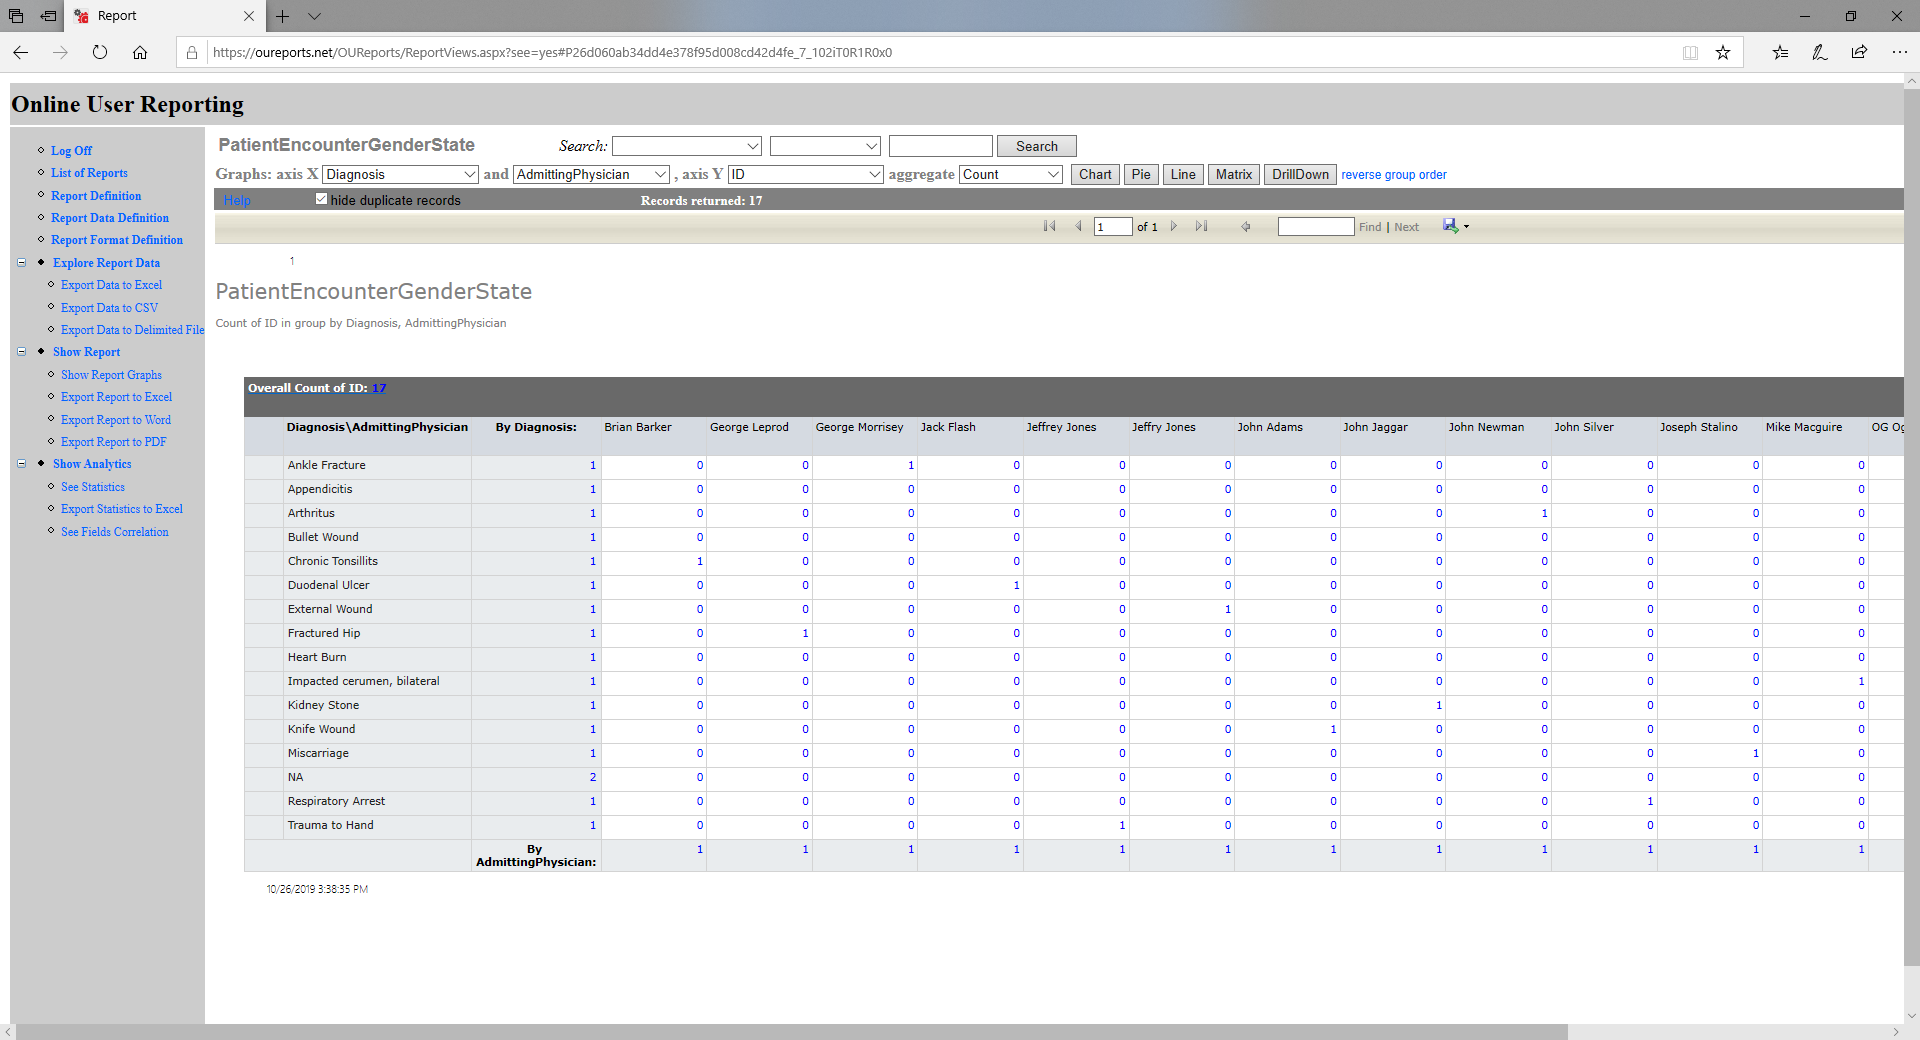
Select different group categories and run reports:
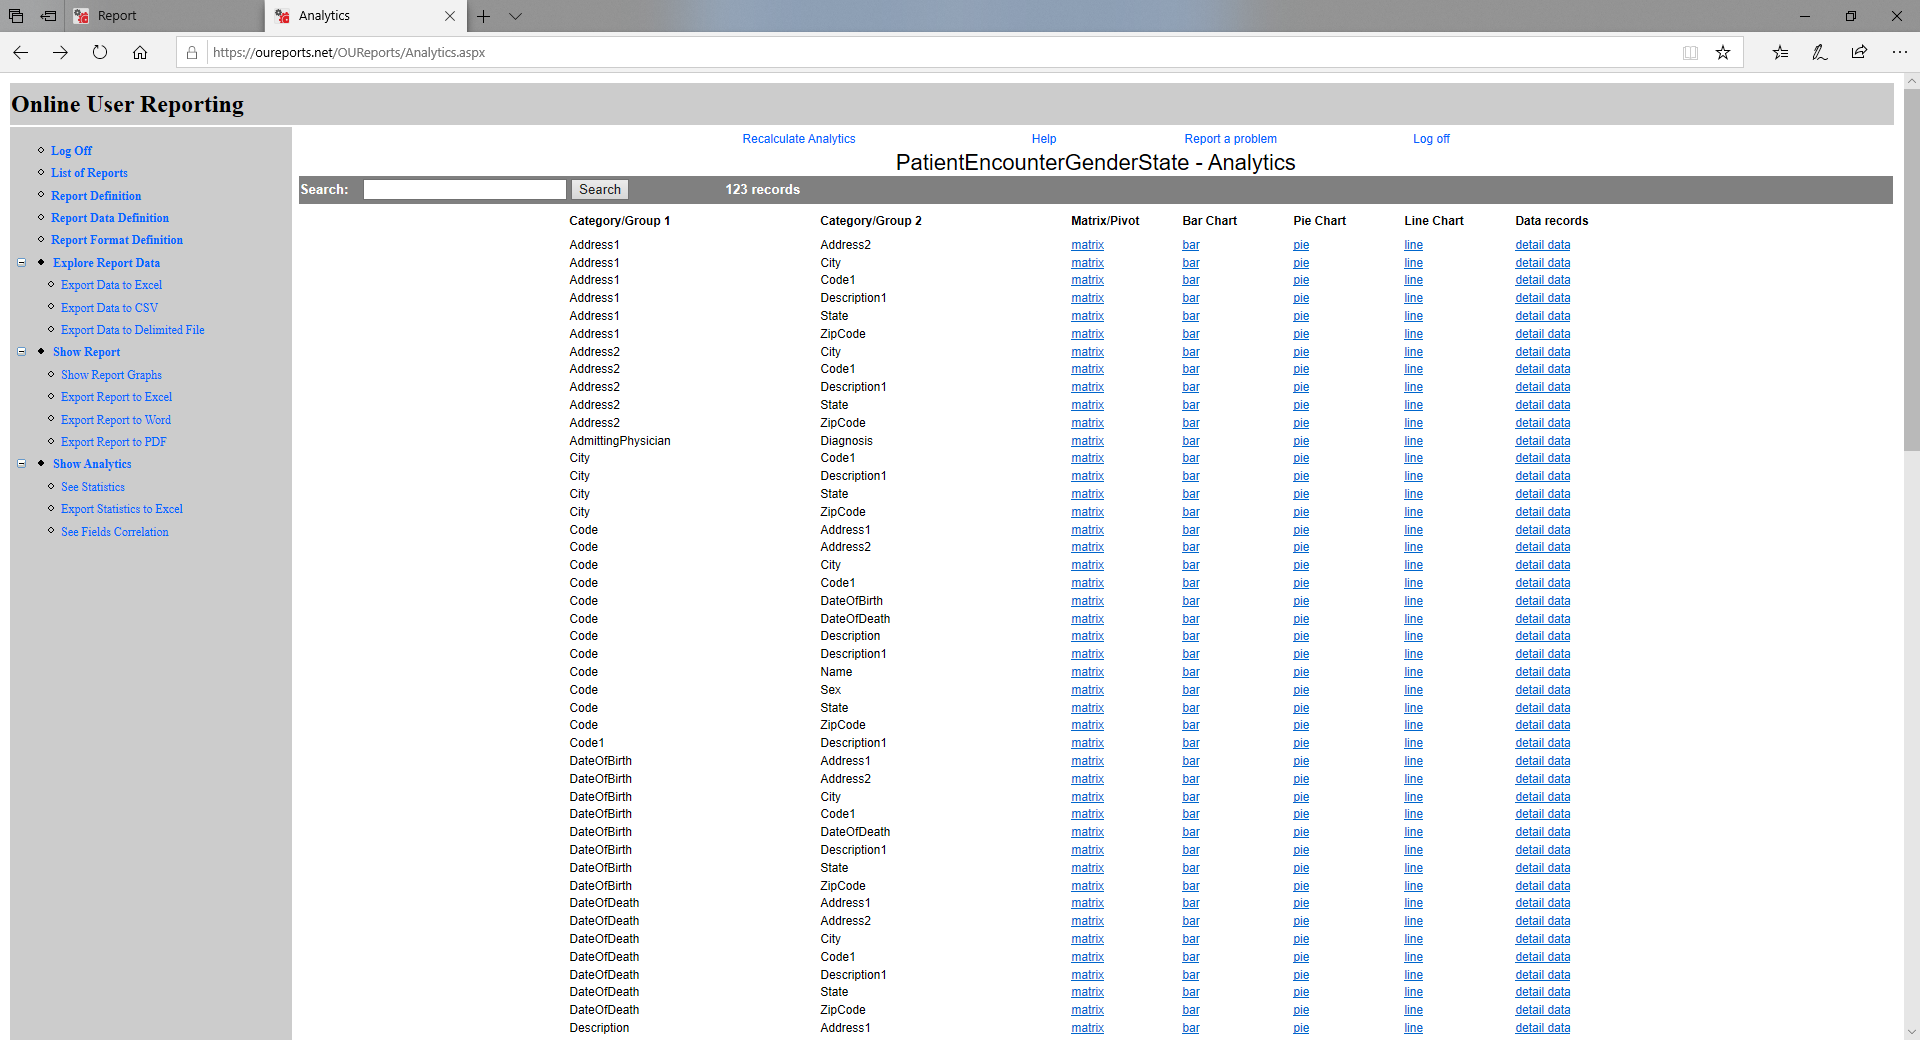
Click Show Analytics from the left menu to see the list of suggested groups. You can run reports from this page links:
Clicking some link:
Click See Fields Correlation from the left menu:
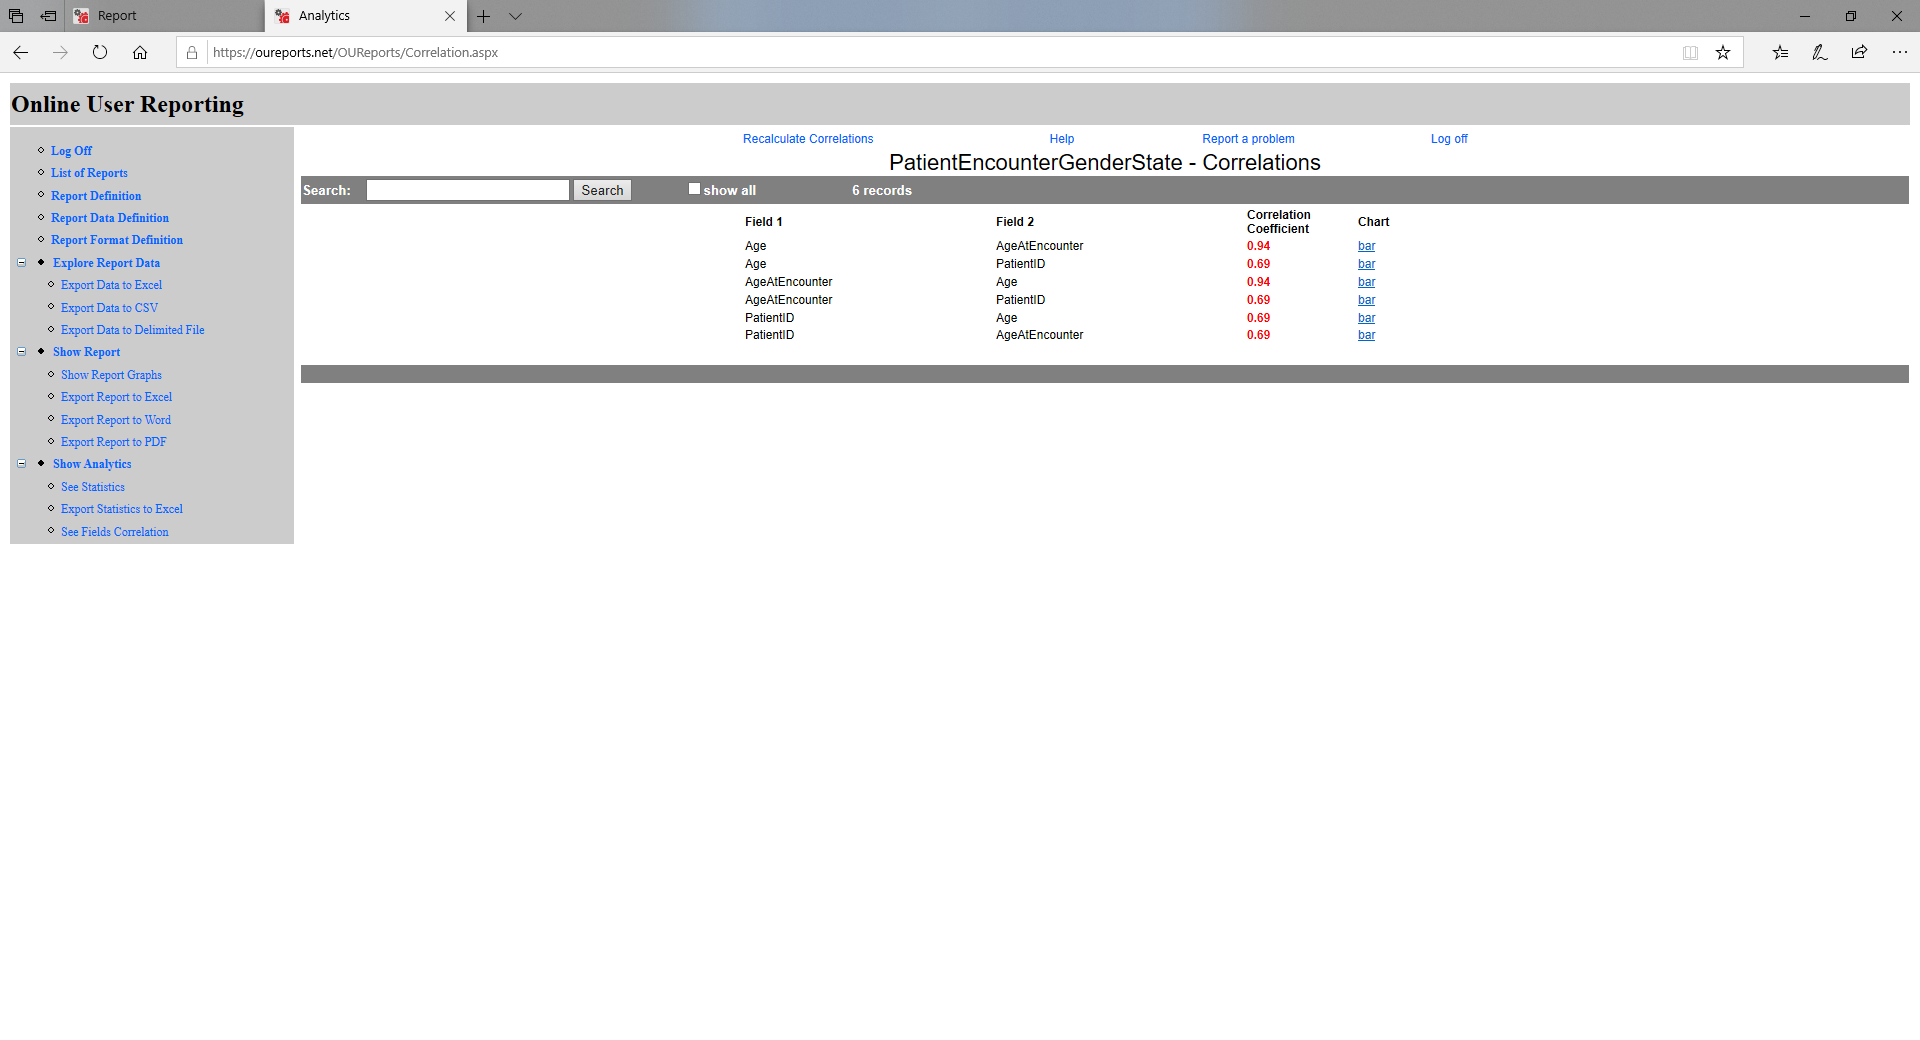
Correlation depends on your data and for small sample data is only for demonstration: